
In this blog we are going to dig into the multiple ways to collect a Lightning UI performance metric, Experience Page Time (EPT). Lightning Experience UI is built as a Single Page Application (SPA). EPT is Lightning’s way of defining a performance metric describing when the page is rendered and can be interacted with. Read more about this challenge in this blog post, Introduction to Salesforce Lightning web performance.
Let’s dig in
You can see the EPT for any page in several ways.
Debug mode
When you enable debug mode for users, they will get EPT rendered at the top of the page.

The color will change depending on EPT. The numbers differ depending on whether it is a desktop or mobile device.
| Desktop | Mobile | |
| Green | 0-2s | 0-4s |
| Orange | 2-5s | 4-8s |
| Red | > 5s | > 8s |
As this blog is focused on performance, please do not use debug mode to view or collect EPT data as it has significant performance penalties.
EPTVisible
The second visual way to see EPT displays the same way as debug mode and can easily be added anytime. It is to set a query string parameter in the URL, eptVisible=1.

This shows the EPT information with the same color scheme you get when turning on Debug Mode. To disable this, you can do eptVisble=0. This is useful for information on your experience as you navigate your org. This is a great way to collect this information from someone complaining about slow pages.
Although it doesn’t have the exact performance costs as debug mode, there are still some performance issues to be aware of. Whenever something gets rendered to the screen, there is a chance that there will be costs for recalculating position elements and re-rendering.
Let’s go to the console
If you want to get EPT without changing the page’s layout (as minimal as it is), we can use the browser developer tools (devtools).
Open up the developer tools and go to the Console tab. There are two ways for you to collect this information.
Performance Marks
All modern browsers support the Performance API, which allows performance marks to be entered and include browser-generated and custom marks. Through the devtools console we can retrieve these marks. For EPT you type the following

This returns an array of PageView EPT marks. As you navigate your org, a new entry will be added for each page. If you are interested in just the latest entry, you can get it with
performance.getEntriesByName("PageView EPT").splice(-1)[0];
The value for EPT here is in the duration field. EPT is the duration field, and the unit is milliseconds. In the example above, EPT is 1382.5ms.
Performance Observer
The second way is to create a performance observer to get the EPT PageView measure.
function perfObserver(list, observer) {
  list.getEntries().forEach((entry) => {
    if (entry.entryType === "measure" && entry.name === "PageView EPT") {
      console.log(`${entry.name}'s startTime: ${entry.startTime}`);
    }
  });
}

const observer = new PerformanceObserver(perfObserver);
observer.observe({ entryTypes: ["measure"] });
This will return the same information provided by the performance marks above.
Which one should I use?
I use the performance marks when I am working directly with the org. This is my version of using eptvisible.
I use the PerformanceObserver when I am programmatically interacting with the browser. My performance testing framework utilizes this method to collect EPT.
Going down the rabbit hole
Have you ever wondered how Salesforce collects client-side instrumentation? If you spend your life looking at network traffic you can learn some interesting things. The process I am describing here is very manual. In my performance testing framework collecting this information is automated.
To follow along log in to your org and open devtools to the network tab. In this example I am going to the recently viewed opportunity list.

In this example there are only two network call (Note: you may see more network requests). The important request here is the one with ui-instrumentation-components-beacon.InstrumentationBeacon.sendData.
This sends a lot of data back to Salesforce so they can collect instrumentation on what has been happening in the browser. If you click on the line with the InstrumentationBeacon and click on the Request tab on the right you will see all of this data.

This is a snippet as the request is quite large. I then right-click on the message, click copy value, and paste it into my favorite editor that supports JSON. I use Visual Studio Code for this, and it has a nice feature to format this data into a nicely laid out JSON document.
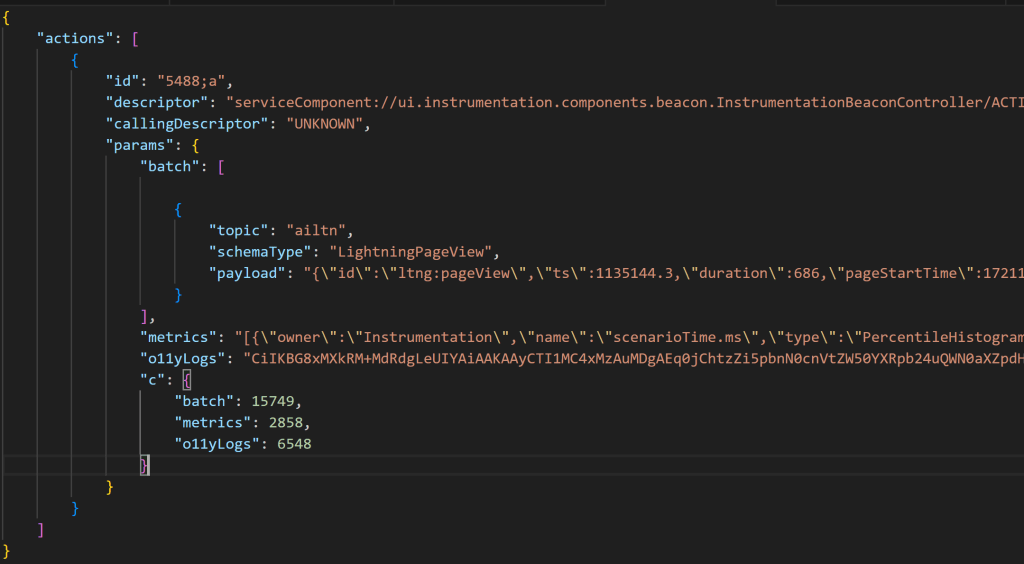
I have removed several lines to highlight my goal of showing that it has an entry for LightningPageView. You see, there is a payload entry where the gold (EPT data) lives. Copy the data from the payload into a new document. You will notice that it can’t be formatted. That is because it is delimited, meaning special character combinations were used. You want to find and replace the characters \” with “to fix this. Now you can format and see a nice JSON document. You can spend a lot of time in this data and there will be a future blog post on this.

If you scroll to the bottom of the document (or search for “ept”), you will see something like this. You see EPT in milliseconds, in this example 685ms. You see that it is the 19th page (sequence) that I have visted and that we are in the standard Sales app on the opportunity object home page.
You can also pay to get this data
Adding licenses for Event Monitoring will also give you this information. If you look at the documentation, you will see that the there is an event type called Lightning Page View event type. Interestingly EPT is called EFFECTIVE_PAGE_TIME. Not sure why it was renamed. It is probably a miscommunication between teams when Event Monitoring was launched and it was too difficult to change.
Deviant behavior
You will see in the LightningPageView JSON blob and the Lightning Page View event type that there are a few other EPT related fields. These are
eptDeviation (EFFECTIVE_PAGE_TIME_DEVIATION) which indicates that something happened before EPT was fired. The eptDeviationReason explains the reason.
eptDeviationReason (EFFECTIVE_PAGE_TIME_DEVIATION_REASON). The documentation describes the possible reasons:
- PageHasError—An undefined page loading error occurred.
- PageNotLoaded—If a customer navigates away from a page while loading processes are in progress, the page doesn’t finish loading.
- PreviousPageNotLoaded—When navigating to a new page, and the previous page hasn’t completed loading, the next page is considered to have a deviation. Incomplete loading processes on a previous page can affect how the next page loads.
- InteractionsBeforePageLoaded—A user interacts with a page element before the page is fully loaded.
- PageInBackgroundBeforeLoaded—A background loading process runs on a page. Background processes run when a user navigates away from a page to another browser tab. The browser de-prioritizes the page in the background until the user activates the page’s tab. Because a user can leave a page in the background for a long time, the page is expected to have a high Effective Page Time (EPT).
Conclusion
Practically there are only two main ways to capture EPT
- eptVisible=1. This is great for collecting anecdotal Real User Metrics
- Browser performance API for use in a lab/test environment.